General Guidelines for the Interpretation of Laboratory Tests
There are numerous programs available for analyzing laboratory test results. The main advantage of these programs lies in the data entry process. Data is entered directly on the screen in the respective output form. This means you always see the final form on the screen (as it will appear when printed) and enter the data directly into the respective fields. To change an entry, simply point to it with the mouse and enter the change.
General description:
* You can save multiple experiments within a project and easily select them within the project. To save time, you can copy the header data for each experiment within a project.
* The ability to save multiple experiments in a single project extends beyond the scope of any single program, as you can save experiments from different lab programs within a single project.
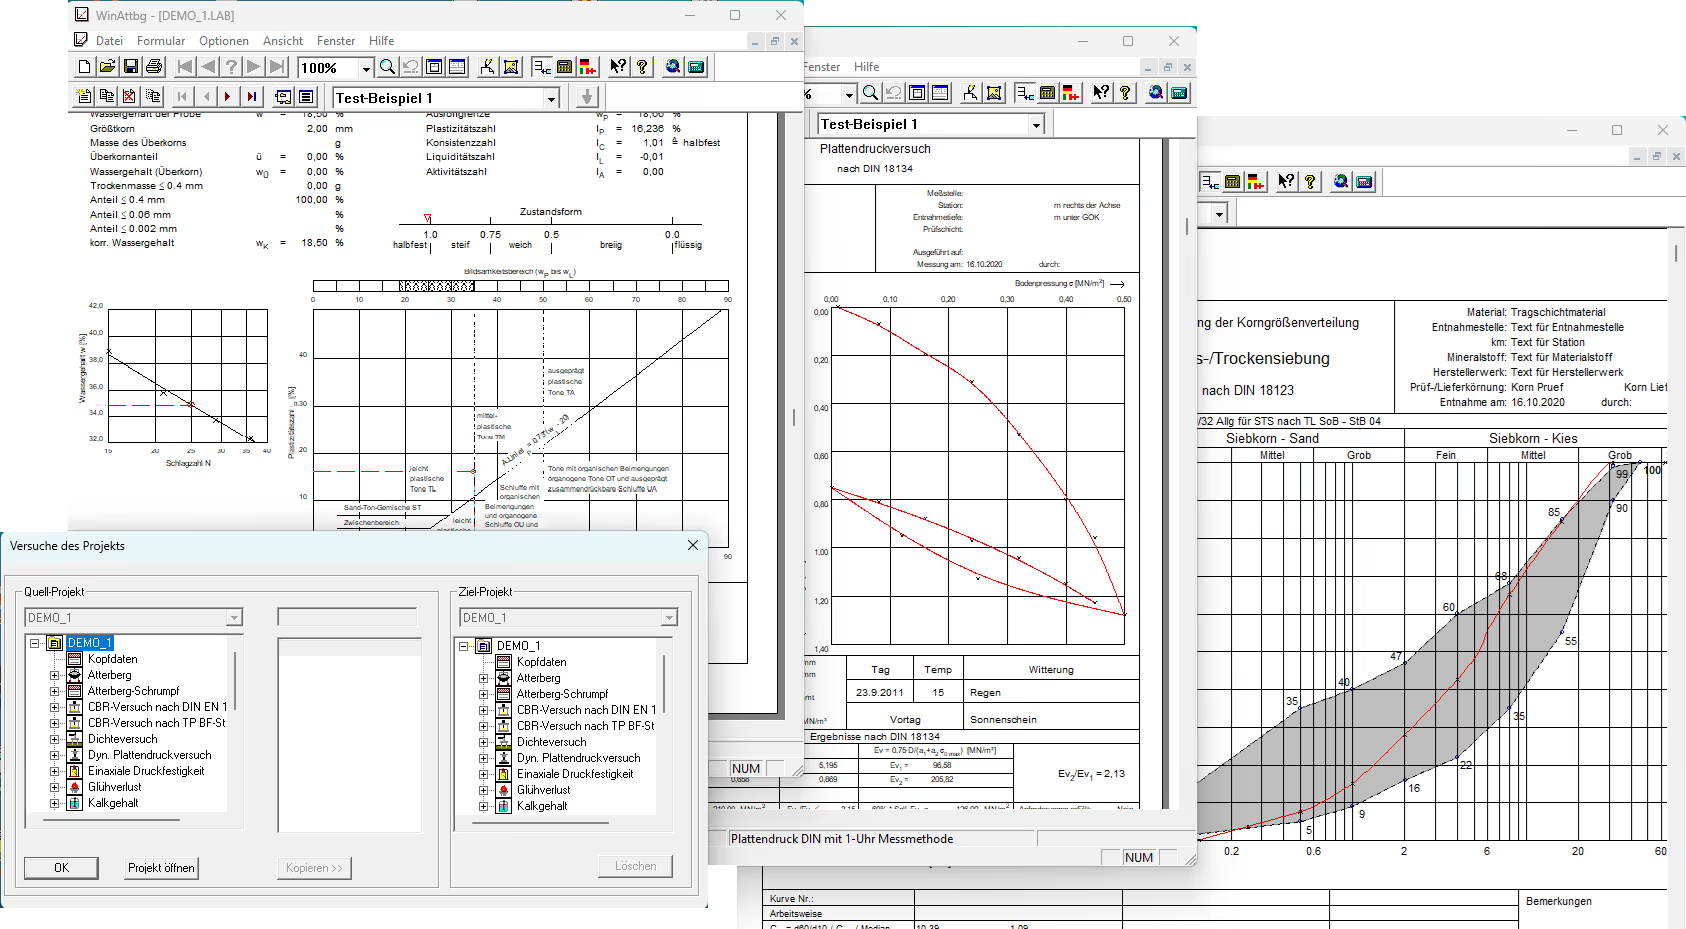
* You can also open multiple projects at the same time in different windows, for example, to compare the results.
* The entire manual is, of course, available as online help. You can also access help for specific sections of the form by clicking the "arrow with a question mark" button.
* Installing the programs is very easy and is done automatically by an installer.
* You can easily add your company logo and name yourself at no extra cost.
Input:
* The main advantage of these programs is the data entry process. Data is entered directly on the screen using the appropriate form. This means you always see the final form on the screen (just as it will appear when printed) and enter the data directly into the appropriate fields. To change an entry, simply point to it with the mouse and enter the change.
* Another advantage is that you have visual control and can see the results immediately on the screen. An easy-to-use zoom function is available to help you see even the smallest details on the screen.
Issue:
* The forms are printed exactly as they appear on the screen when you enter data. You can, of course, check the layout using the standard Windows print preview.
* The runs of a project (from the current program) can be printed in a batch without having to take action after each run. For some programs, the print output can be limited.
* Export functions for Excel, PDF, and various graphic formats (BMP, DXF, EMF, SVG, JPG, PNG, etc.) are also available. Bitmaps can also be saved as a cropped section to either a file or the clipboard.
* For programs that include charts, you can manually adjust the output grid.
No items found.
Areas
The individual programs are described in more detail below:
WinAttbg - Determination of Atterberg Limits
WinAttbg - Determination of Atterberg Limits
WinCBR - Determination of the California Bearing Ratio
WinCBR - Determination of the California Bearing Ratio
WinDicht - Determination of density and moisture content
WinDicht - Determination of density and moisture content
WinDurch - Permeability Test
WinDurch - Permeability Test
WinDynPl - Dynamic plate load test
WinDynPl - Dynamic plate load test
WinEinax – Software for determining uniaxial compressive strength
WinEinax – Software for determining uniaxial compressive strength
WinEns – Determination of Water Absorption Capacity
WinEns – Determination of Water Absorption Capacity
WinGlueh – Determination of Loss on Ignition
WinGlueh – Determination of Loss on Ignition
WinKalk – Determining the lime content
WinKalk – Determining the lime content
WinKomp – Compression test with restricted lateral expansion
WinKomp – Compression test with restricted lateral expansion